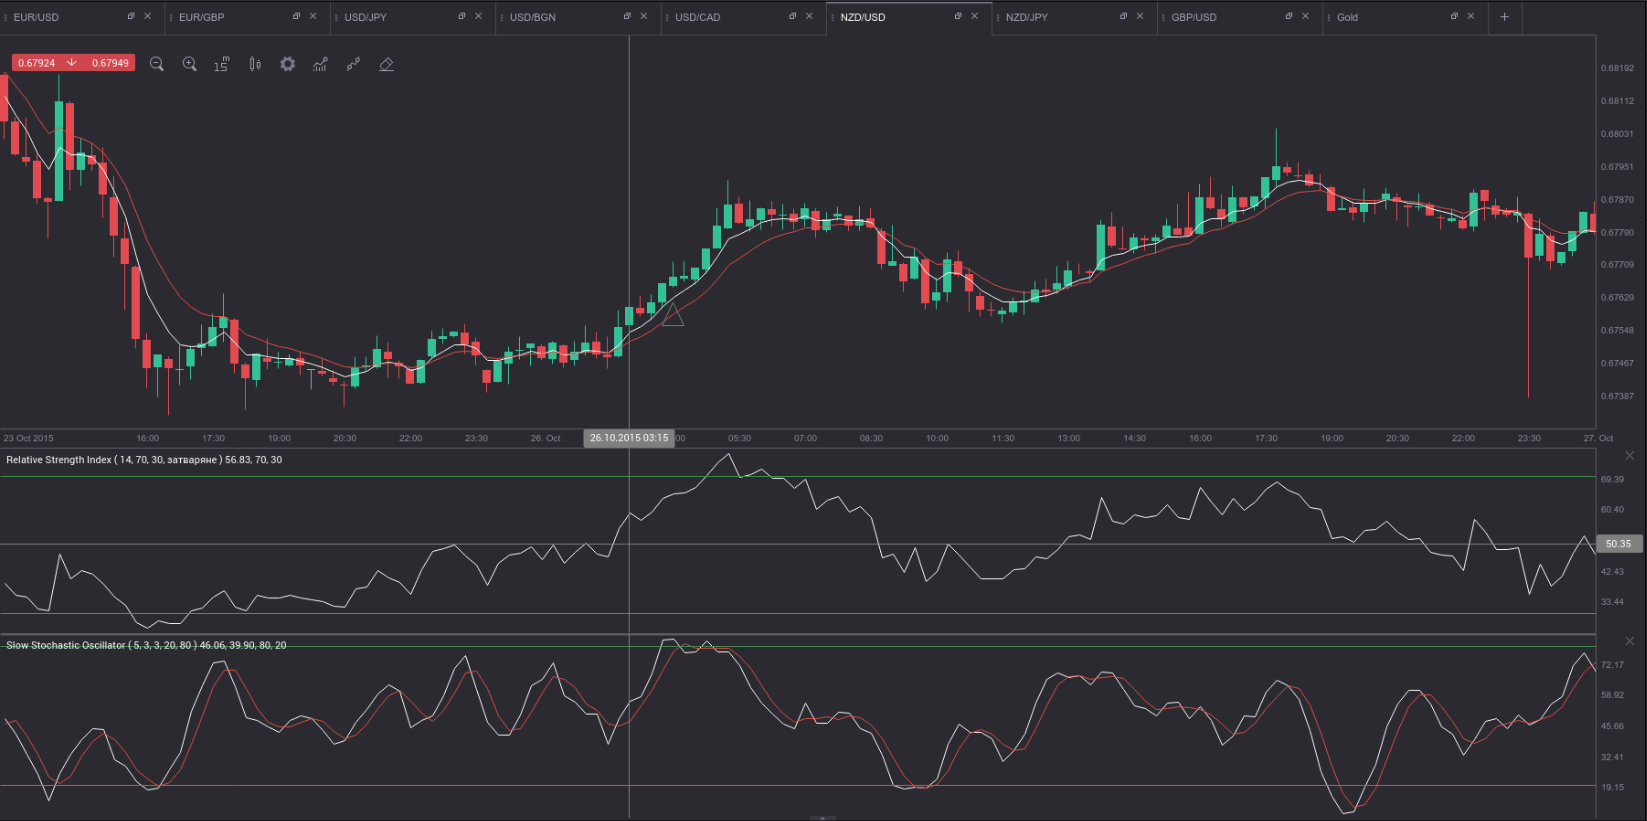
For this strategy we will utilize another combination of technical indicators – two exponential moving averages with different periods, the Relative Strength Index (RSI) and the Stochastic Oscillator. We need a shorter-term Exponential Moving Average (5-day EMA, white on the charts below) and a longer-term one (10-day EMA, red on the charts below). In addition, we will use the default settings of the RSI (14 periods, 30.00 as oversold, 70.00 as overbought) and the Slow Stochastic with settings (5, 3, 3, oversold at 20.00, overbought at 80.00). The time frame is set to 15 minutes, while the expiry time is 60 minutes (a four-candle expiration time).
In order to make trading decisions, one needs to take into account the following conditions:
If he/she is to buy a Call option:
1. The 5-day EMA needs to cross the 10-day EMA in a bottom-up manner,
2. The RSI needs to stand between its 50.00 level and the 70.00 level,
3. The Slow Stochastic needs to be between the 20.00 and the 80.00 levels and ascending.
If he/she is to buy a Put option:
1. The 5-day EMA needs to cross the 10-day EMA in a top-down manner,
2. The RSI needs to stand between its 30.00 level and the 50.00 level,
3. The Slow Stochastic needs to be between the 20.00 and the 80.00 levels and descending.
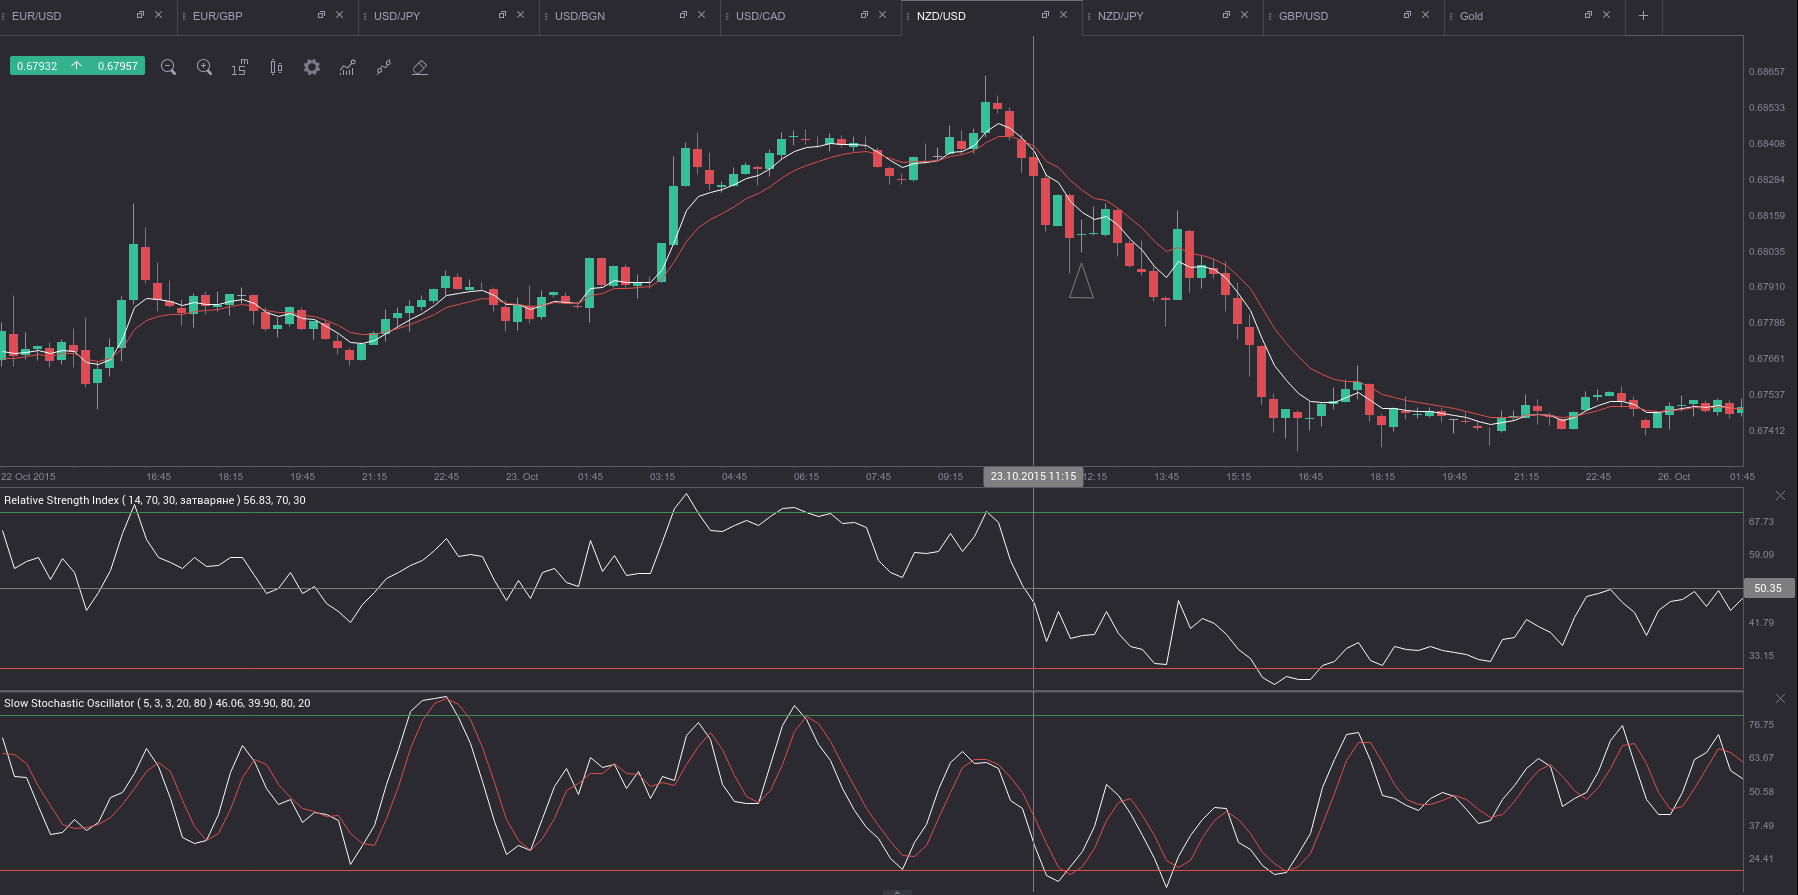
You should make sure that all three conditions are present before you make your entry.
On the 15-minute charts above the vertical lines mark where a call and a put entry should be made, while the triangles mark the expiry.