 Hersheys, the widely known chocolate manufacturer, is not only popular with its boxes of chocolate. Among investors the chocolate giant has other important uses. For example, some analyst believe that Hersheys sales can tell you much about where the market would go next.
The logic behind the candy-maker is explained by Brian Stutland of the Stutland Volatility Group: “Your basic thing that everybody loves is chocolate,” Stutland said to CNBC reporter. “If chocolate sales are falling—if you hate chocolate—you definitely hate real estate or whatever big-ticket purchases you want to make.”
An interesting fact is that, CNBC analysis showed that since 1985, Hersheys coefficient of correlation with the S&P 500s performance nine months later is an impressive 0.86 which represents 86% similarity. That means that 86% of the time that Hershey shares have moved higher or lower on a daily basis, the S&P tracked the movement nine months later.
But betting solely on that is missing the big picture. Obviously there isnt a direct correlation between the index and Hersheys sales. What the “Chocolate indicator” give us according to Jonathan Feeney, an analyst who covers Hershey for Janney Montgomery Scott, is a real-time peek on the consumer attitude. Because of this fact, looking at staple companys demand to predict the markets next move or estimate government indicators has become a popular strategy.
Feeney explained for CNBC, the meaning of Hersheys indicator: “And as a way of understanding consumer fundamentals, it is pretty valid. Its a lot more real-time than anything the government sends out, because they interact with a high volume of consumers on a daily basis.”
All of the investors dont seem to embrace the Chocolate indicator theory arguing that it might be similar to another case called “Butter in Bangladesh”. Bottom line, the indicator shouldnt be consider by itself but in the context of things happening could give you a hint of what might happen in S&P 500 index.
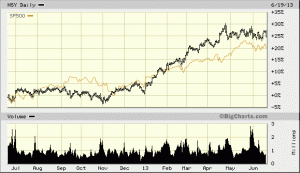
So using the theory of Chocolate indicator let see what will happen according to the chocolate manufacturer graph. Actually, it predicts that the S&P will be flat because since April 2012, Hershey shares have risen by only 3 percent.
The following graph shows correlation between Hersheys (black line) and the S&P 500 index (brown line). The graph used was for 1 year time period from Bigcharts.


